Analytics — Advanced analysis at the heart of your QCs
Analytics transforms your quality control data into actionable insights. A robust database, a fast and intuitive interface — from data entry to advanced analysis.

- Centralize and structure the analysis of your QC data
- Anticipate drifts before tolerance thresholds are exceeded
- Objectify your decisions based on consolidated data
- Demonstrate the stability and capability of your equipment
A comprehensive analysis, from monitoring to advanced statistical control
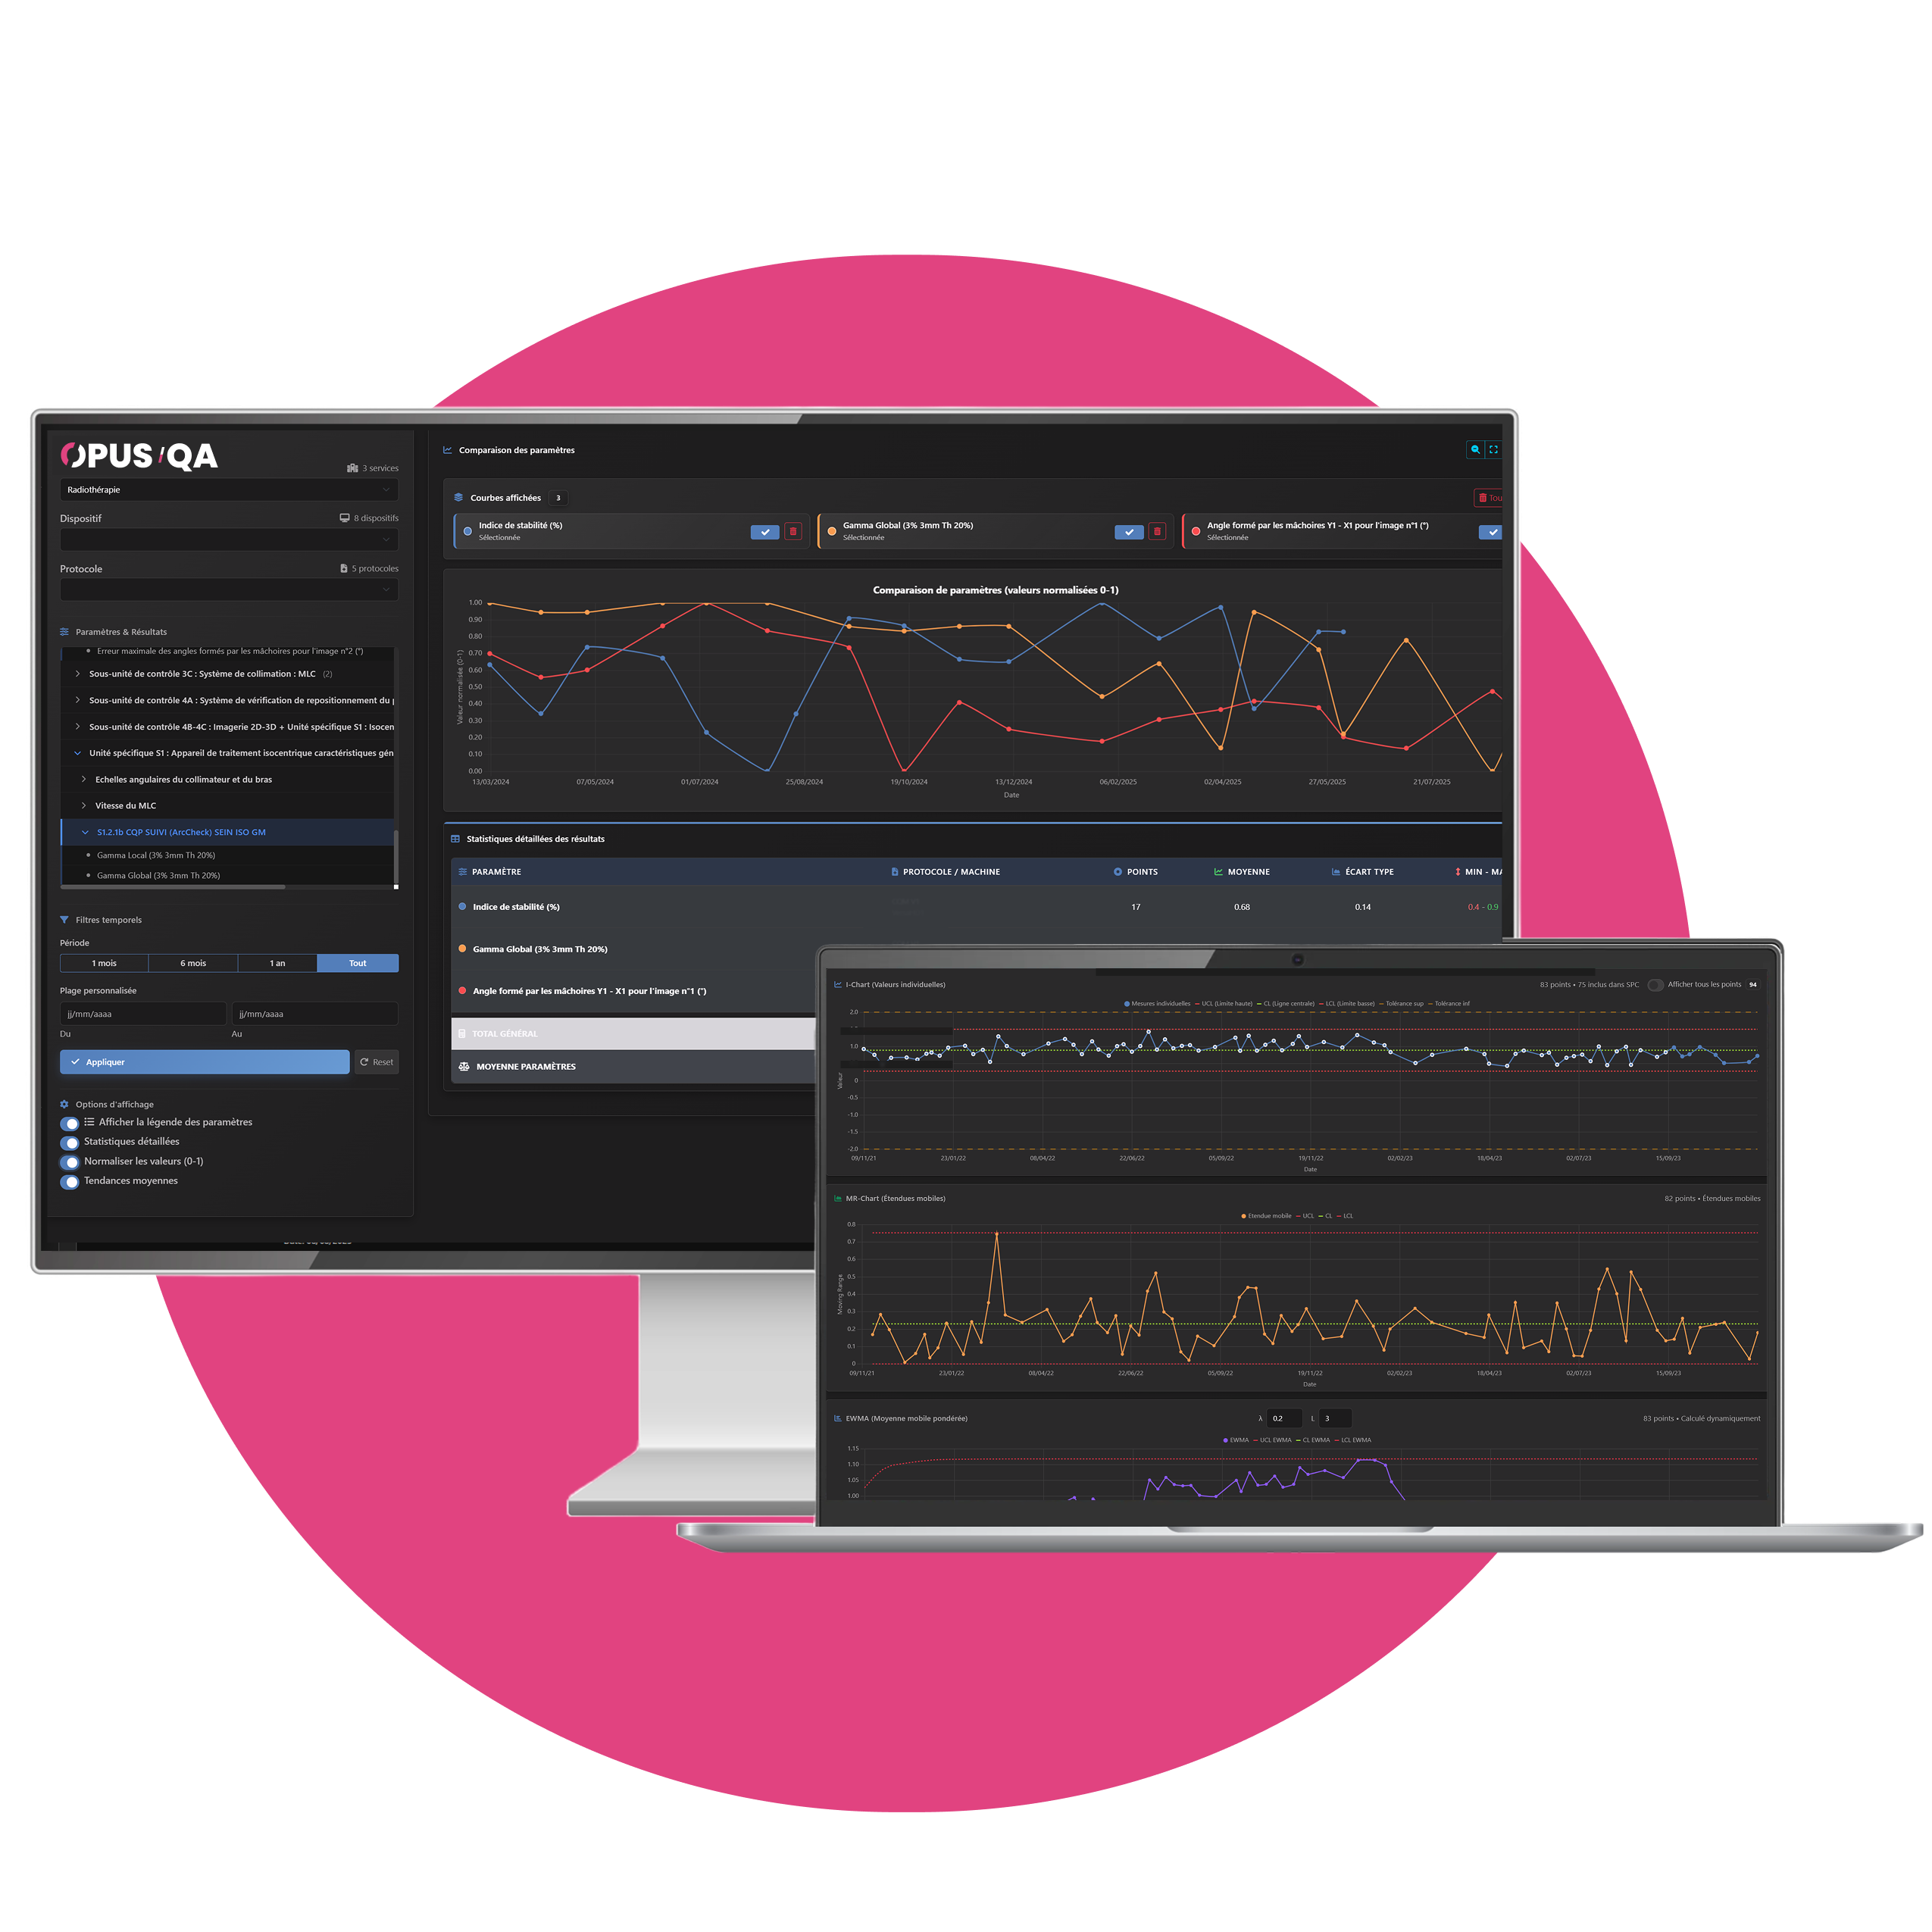
Track the history of your controls as curves. Identify trends, drifts and the evolution of your equipment performance over time.
- Selection panel — Department, device, protocol, parameters & results
- Visualization — Curves or tables of your choice, results displayed with color coding
- Time filters — 1 month, 6 months, 1 year or custom range
- Display options — Show tolerances, trend line (linear or polynomial regression)
- Statistics — Mean, median, min, max, standard deviation, variance per parameter
- Comments — Integrated annotation management on results
Overlay multiple numerical data series on the same chart. Automatic normalization enables relevant comparisons between parameters of different scales.
- Free overlay — Add multiple numerical results on the same chart
- Automatic normalization — Option to normalize values (0-1) and compare different scales
- Unlimited combinations — Cross-reference Department / Device / Protocol / Parameter as needed
- Parameter legend — Clear identification of each curve
- Detailed statistics — Parameter, protocol/equipment, points, mean, standard deviation, min-max
- Average trends — Enable the display of average trends
Analyze the same parameter across your entire equipment fleet. The ideal tool for inter-equipment benchmarking and practice harmonization within your department.
- Automatic detection — Identifies similar results between devices
- Equipment selection — Show all / Hide all buttons, selective curve hiding
- Overlay view — Grouped or separate visualization of curves per equipment
- Per-equipment statistics — Table with points, mean, standard deviation and min-max for each device
- Global statistics — Aggregation across the entire fleet
Analyze the stability and capability of your processes with statistical control charts. Detect drifts, abnormal variations and monitor quality in real time.
- I-Chart — Individual values with UCL, CL, LCL limits and tolerances
- MR-Chart — Moving ranges for monitoring short-term variability between successive observations
- EWMA — Exponentially weighted moving average to detect small progressive drifts (adjustable λ and L)
- Capability indices — Cp, Cpk, Pp, Ppk with interpretation and visual status
- Nelson rules — Automatic and early detection of drifts
- Distribution — Distribution chart to identify and validate a stable reference period