Dashboard — The global view of your QC activity
The Dashboard is the home page of OPUS QA. It provides a complete view of the status of your equipment and performed quality controls. Two display modes adapt to all use cases: the operator's daily workflow as well as the quality manager's supervision needs.
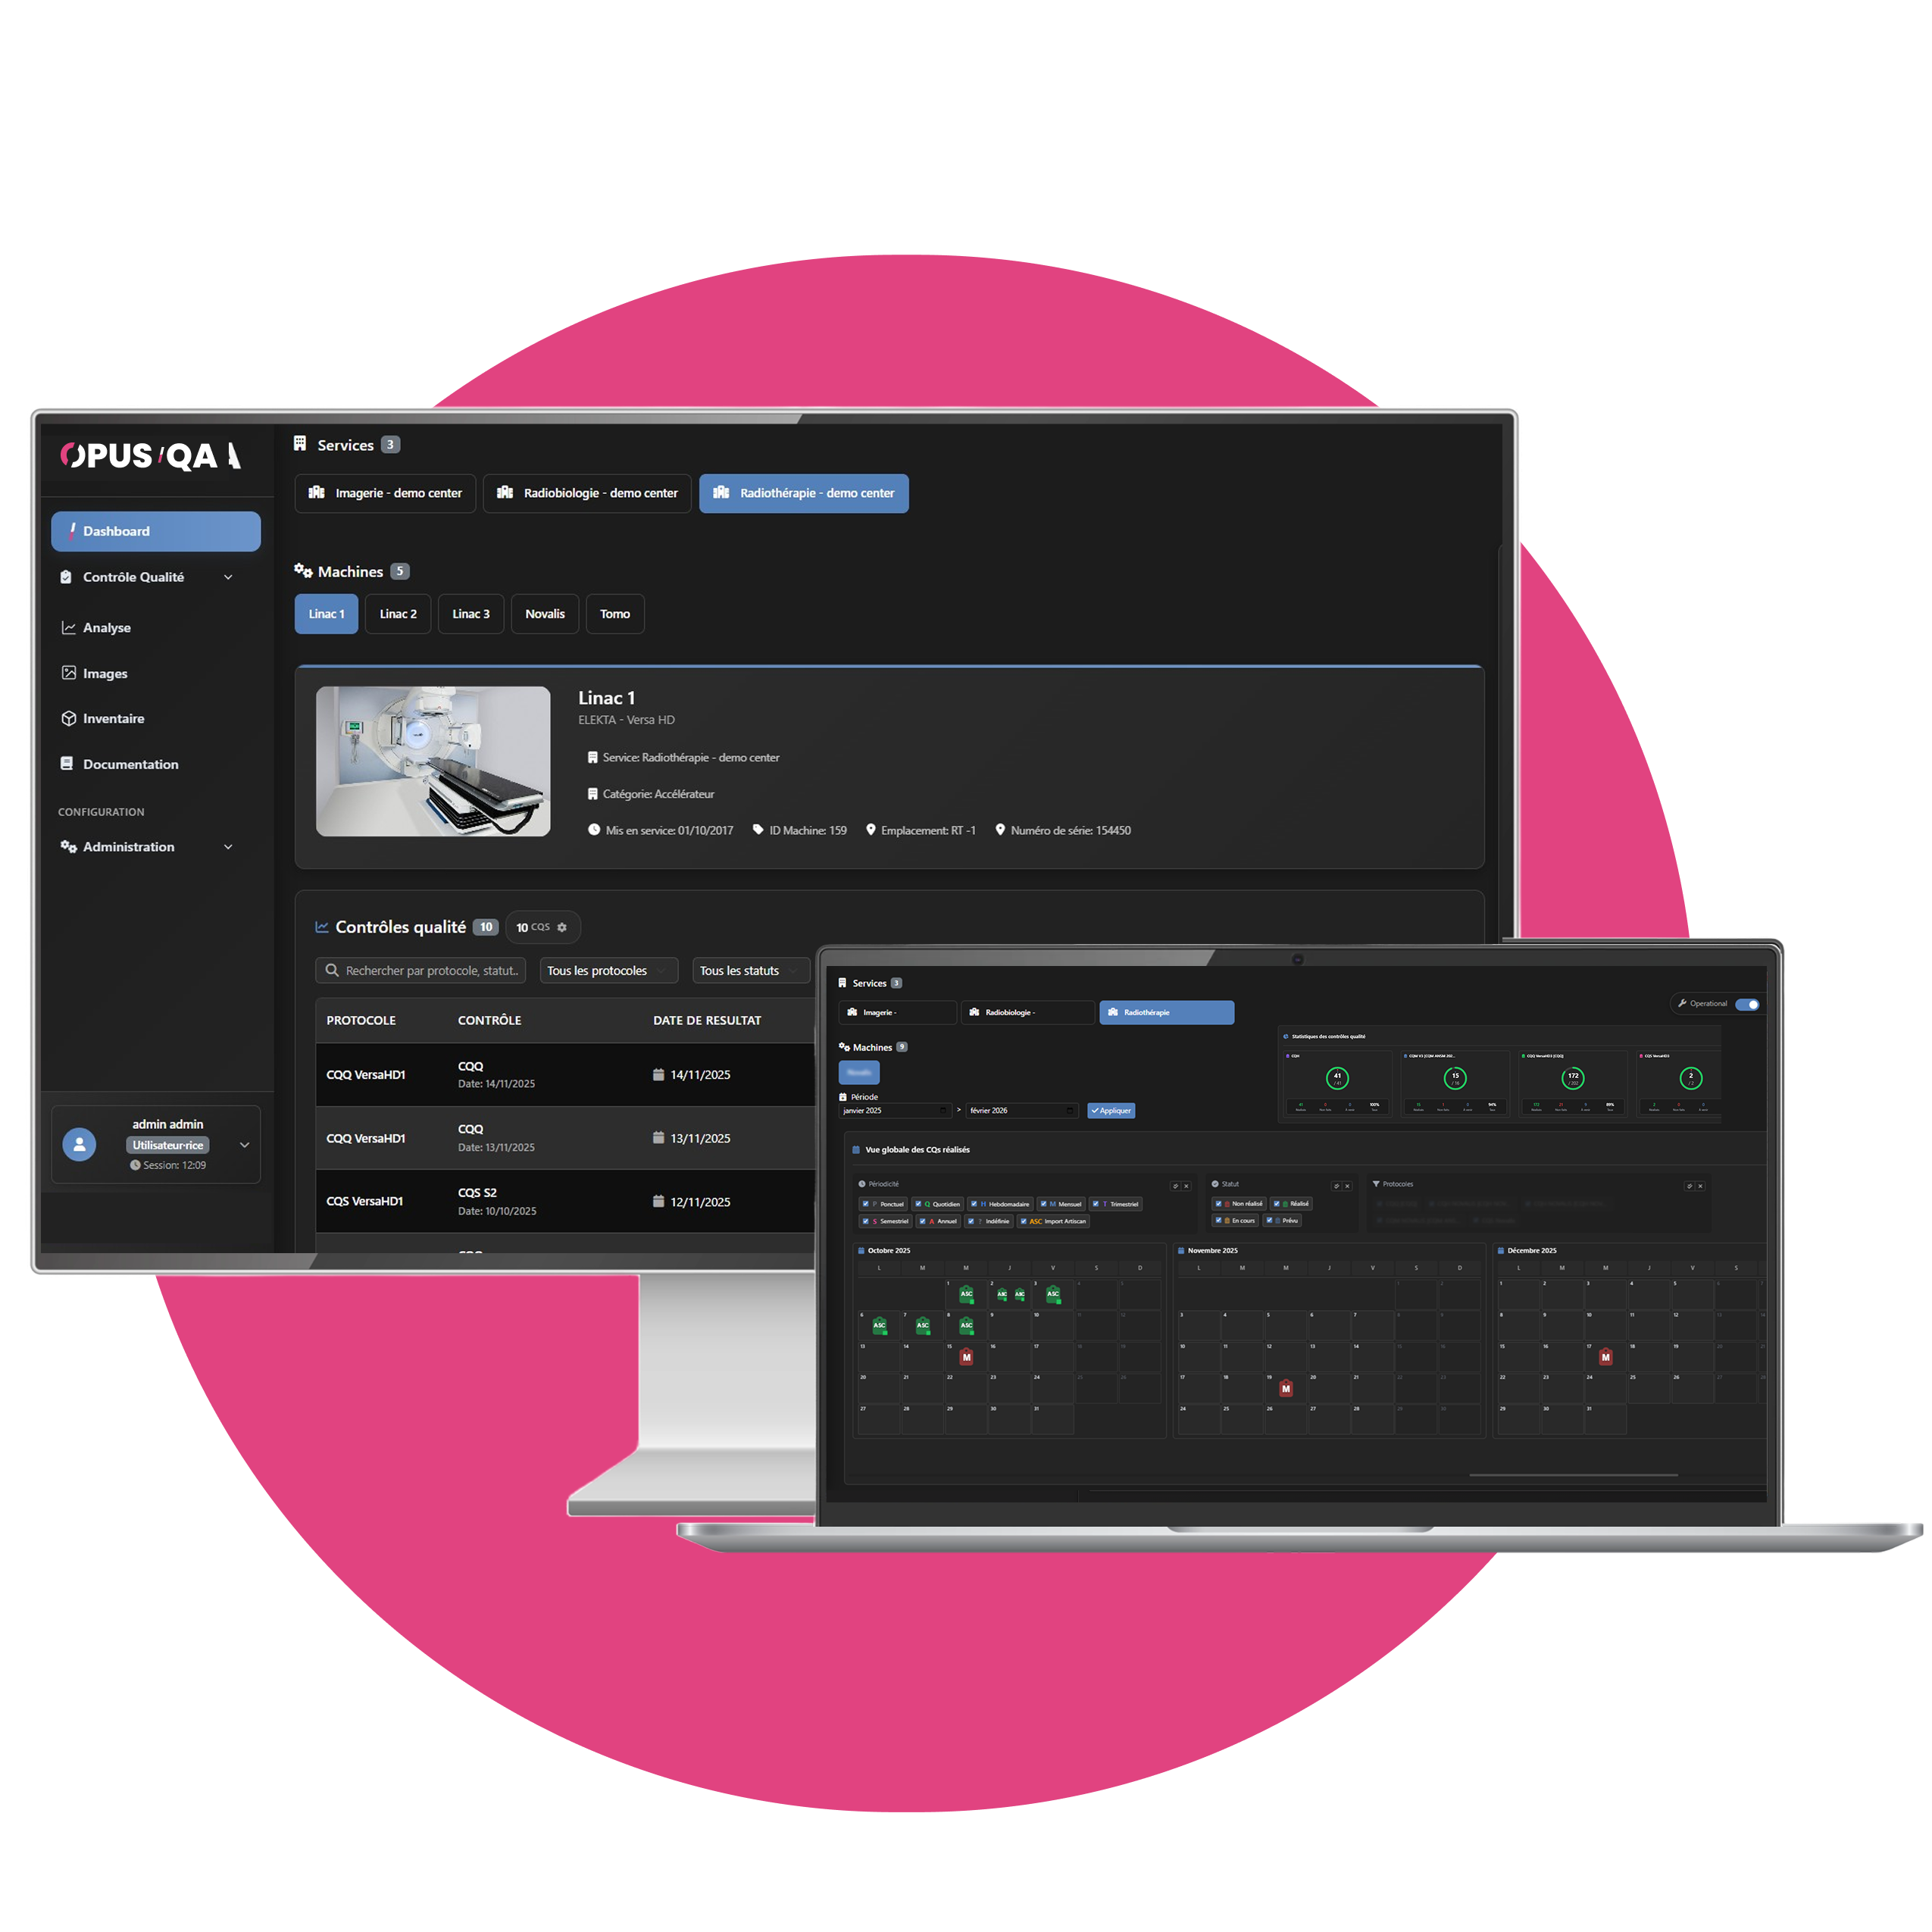

Two modes, one single tool
Operational View
Default mode. Intuitive navigation: select the department and equipment to access all its information — technical details, complete QC history, scheduling.
Supervision View
Customizable dashboard with modular widgets. Ideal for quality managers and responsible physicists. Filterable by department, equipment and time period.
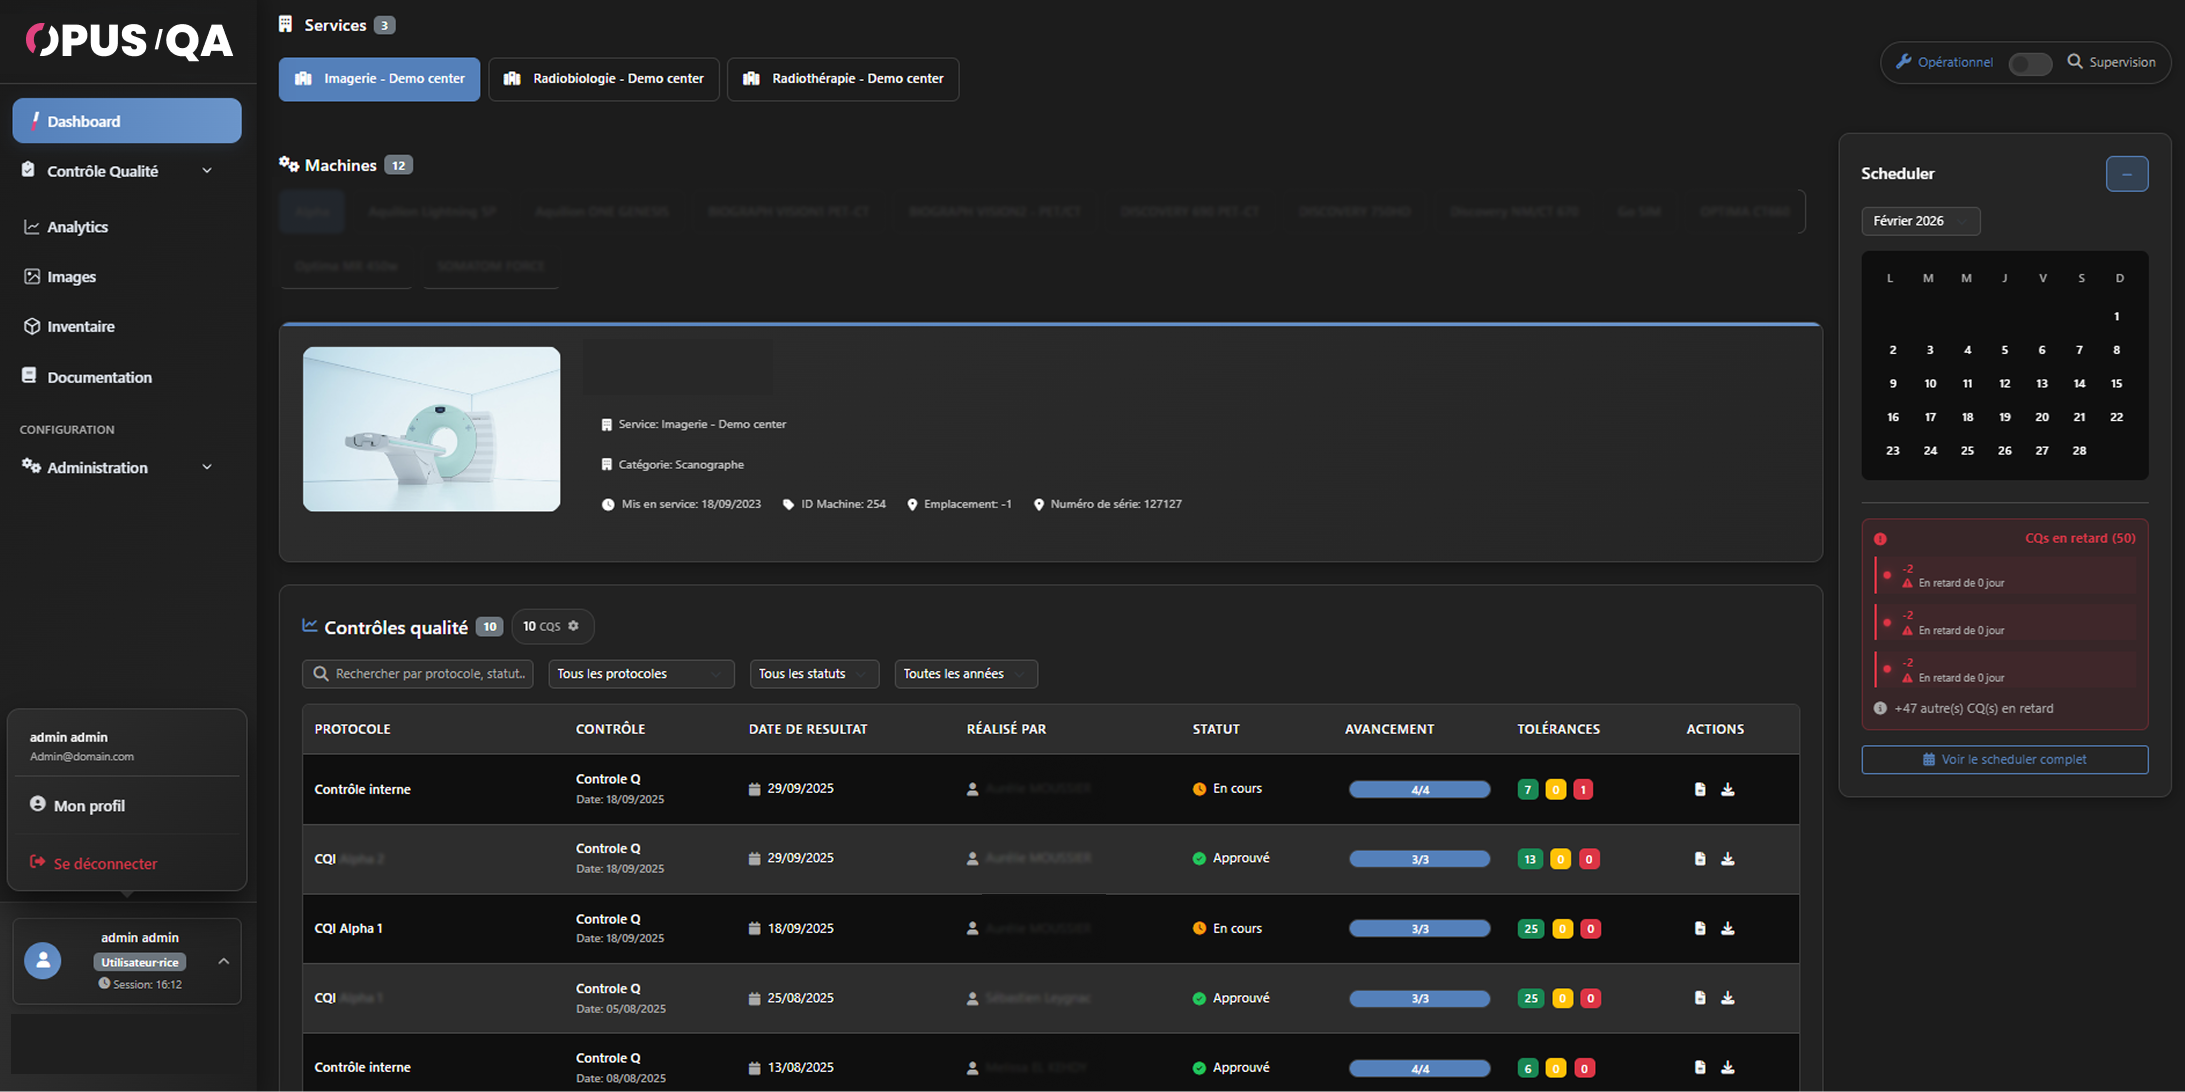
Operational View - Everything you need, equipment by equipment

Department navigation
Switch between your facility's departments (Radiotherapy, Imaging, Radiobiology…). The active department is highlighted. Then select the equipment from the listed devices.

Complete equipment profile
Equipment photo, name, model, department, category, commissioning date, location, serial number and unique identifier. All technical information readily accessible.

QC History
Complete list of performed controls with protocol, date, operator, status, progress bar and tolerance indicators (green/orange/red). Detailed tooltip on hover.

Scheduler — Planner
Monthly calendar with navigation. List of overdue controls ranked by priority with color coding. Direct access to the detailed scheduling view from the dashboard.

Tolerance indicators
Immediate color coding on QC results: compliant (green), under surveillance (orange), out of tolerance (red). Parameter details accessible directly from the history.

Reports and export
View and download QC reports directly from the history list. Actions available for each control: detailed report and results download.
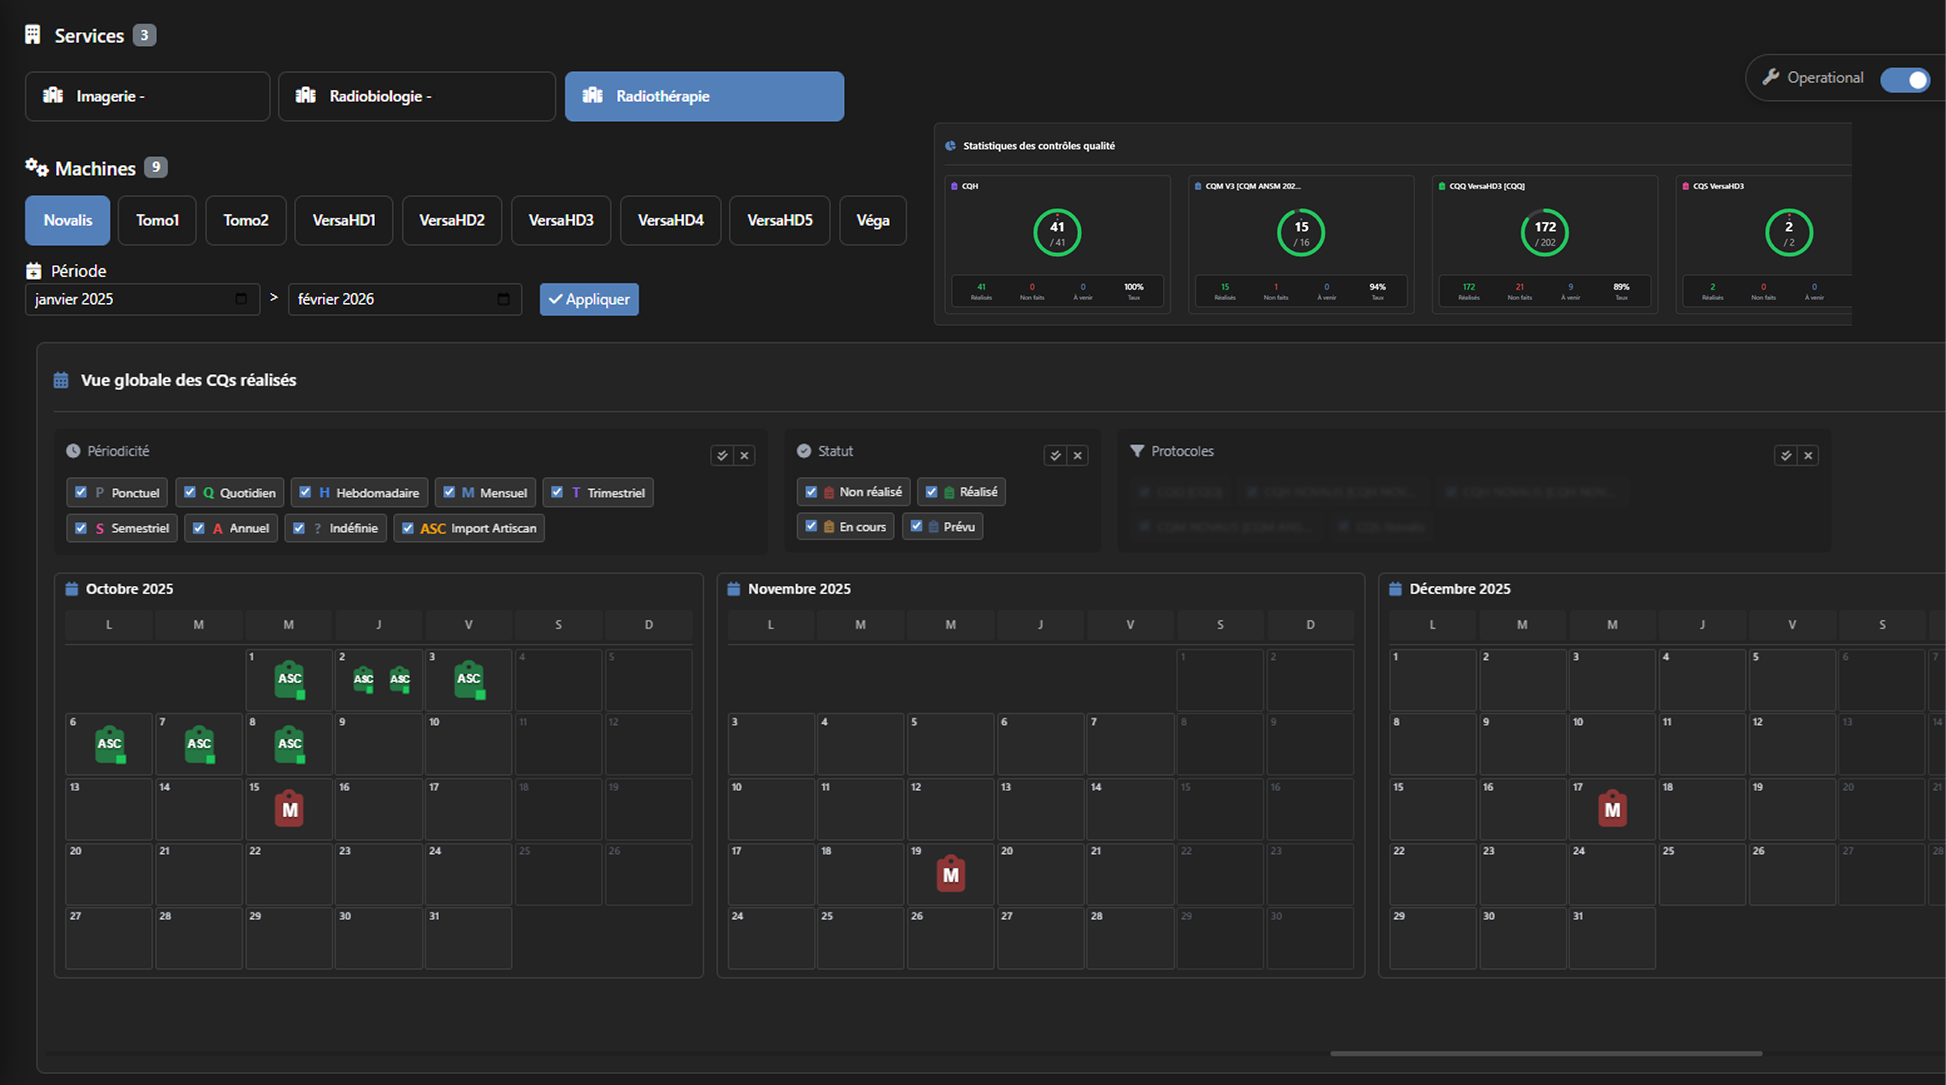
Supervision View - A customizable dashboard to manage your equipment fleet

Global view of performed QCs
Multi-month calendar displaying all performed quality controls. Click on a date to view the details: protocol, status, periodicity, validator, results.

QC Statistics
Visual progress indicators for each protocol. Progress circle with performed/total ratio, number of completed controls, pending, upcoming and completion rate.

Evolution chart
Visualization of the evolution of a specific parameter over time as a curve. Integrated directly into the supervision dashboard for quick access.

Latest comments & Performed parameters
Widget tracking the latest annotations and comments left during QCs, along with a summary of the parameters performed over the selected time period.
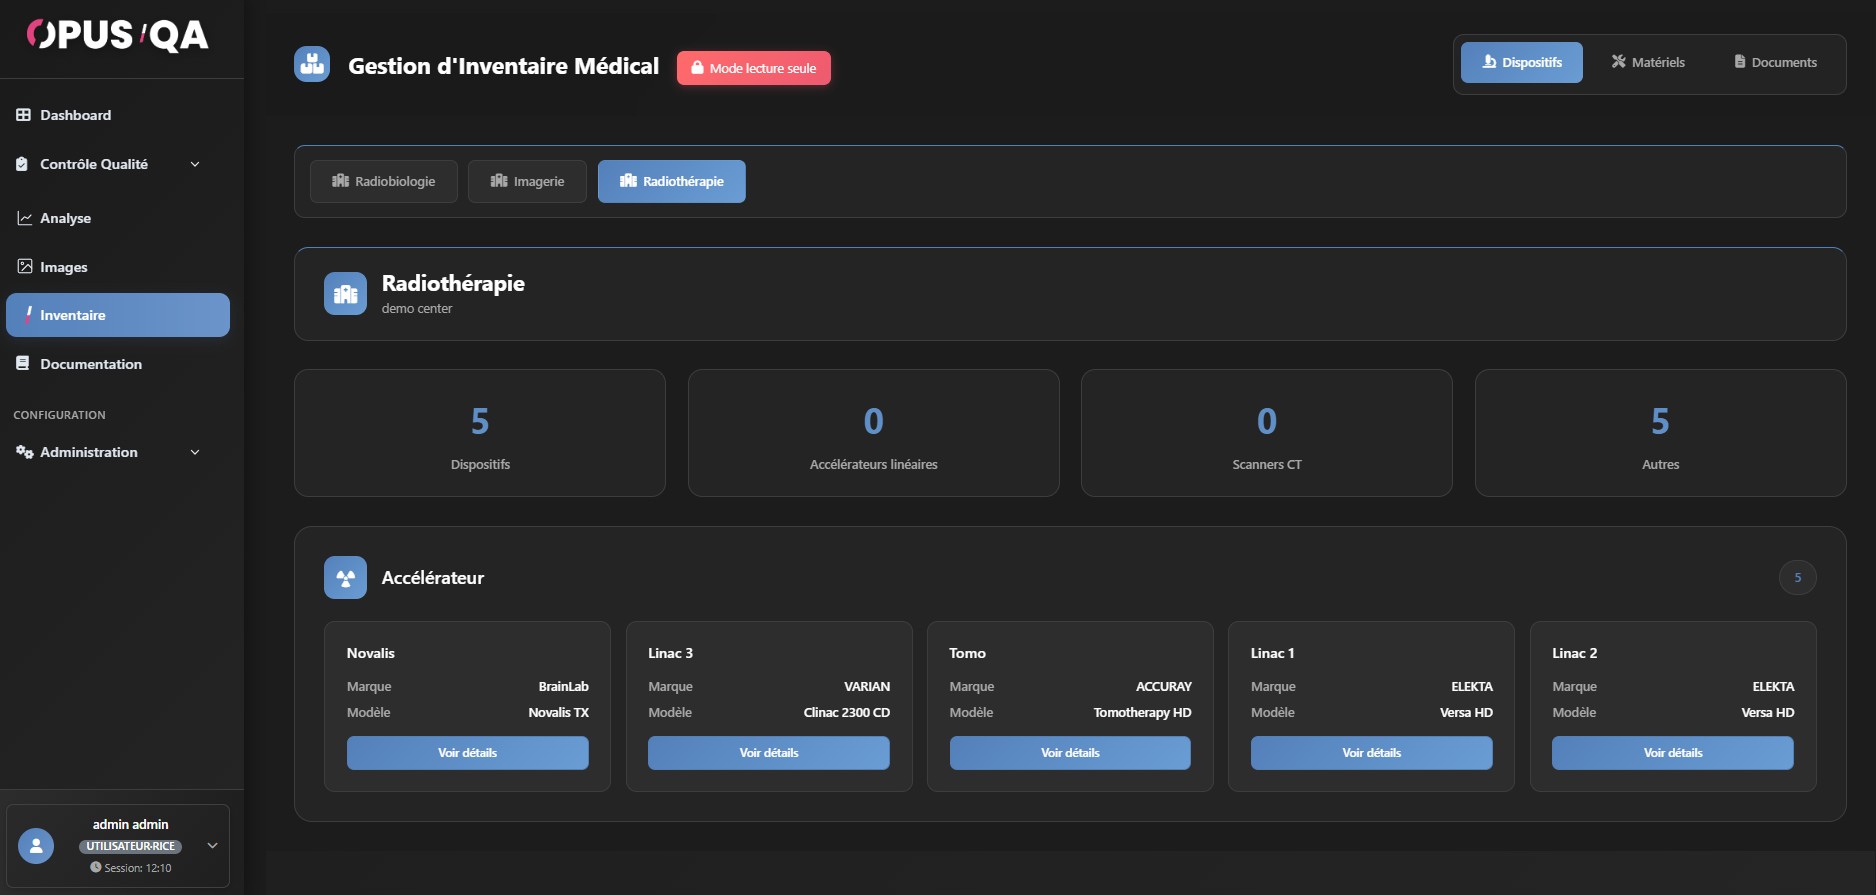
Your equipment fleet, centralized
The inventory centralizes all equipment and devices in your facility. Structured view by department, with all technical information.
|
 |